|
|
This page contains the following further information for sustaining the environment:
|
GLOSSARY
Climate change
A change in the weather over periods of time that range from decades to millions of years. It can be a change in the average weather or a change in the distribution of weather events around an average (for example, greater or fewer extreme weather events). Climate change may be limited to a specific region, or may occur across the whole earth. In recent usage, climate change usually refers to changes in modern climate and is often referred to as global warming.
Fly ash
Fly ash is a pre-consumer waste generated during the combustion of material, most usually coal for electricity generation (a secondary industry). It is also sometimes classified as a hazardous or regulated waste. (Hyder consulting, 2012)
Greenhouse gas
A collective term for those gases which reduce the loss of heat from the earth's atmosphere and thus contribute to global warming and climate change. Examples of greenhouse gases are water vapour, carbon dioxide, atmospheric methane, nitrous oxide, ozone and chlorofluorocarbons (CFCs).
Kyoto Protocol
The Kyoto Protocol to the United Nations Framework Convention on Climate Change (UNFCCC) is an international treaty that sets binding obligations on industrialised countries to reduce emissions of greenhouse gases. The Protocol was adopted in 1997, and entered into force in 2005.
Landfill
A site used for the controlled and legal deposit of solid waste onto or into land. (Hyder consulting, 2012)
Mt CO2-e
Millions of tonnes (Mt) of carbon dioxide equivalent (CO2-e) gases.
Natural capital
While there are four basic categories of natural capital that are generally recognised: air, water (fresh, ground water and marine), land (including soil, space and landscape) and habitats (including the ecosystems, flora and fauna which they both comprise and support)), the System of National Accounts (SNA) only includes estimates of the value of these resources where they fit the definition of an economic asset (i.e an economic asset must have an identifiable owner and the owner must be able to hold or use these assets for economic gain). In this regard, our partial measure of natural capital includes the value of subsoil assets, land and timber, while other aspects such as water, habitat and ecosystems and soil resources are not explicitly included.
Recycling
A resource recovery method involving the collection and processing of waste for use as a raw material in the manufacture of the same or similar non-waste products.
Reuse
Recovering value from a discarded item without reprocessing or re-manufacture. Typically this will involve an item being reused in its original function or similar. It does not preclude relatively minor pre-treatments like washing, reconditioning or painting.
Sustainability
While sustainability is a concept that continues to evolve, in MAP, we have used the following broad 'capital' approach to defining sustainability. A capital approach to sustainability requires that the stock of capital from which wellbeing is produced not be diminished over time relative to the population. For a more in-depth discussion of this concept see the 'Sustainability' chapter of ABS Completing the Picture - Environmental Accounting in Practice, May 2012 (cat. no. 4628.0.55.001).
United Nations Framework Convention on Climate Change
The UNFCCC is an international environmental treaty negotiated at the United Nations Conference on Environment and Development held in Rio de Janeiro in 1992.
Waste disposed
Solid waste disposed of to landfill, incinerated or destroyed without energy recovery, or is unrecovered litter. Solid waste being anything that is ‘spadeable’, i.e. can be picked up with a spade. (Hyder consulting, 2012).
|
REFERENCES
ABS, 2012, Completing the Picture - Environmental Accounting in Practice, May 2012 (cat. no. 4628.0.55.001)
ABS, 2013, Information Paper: Towards the Australian Environmental-Economic Accounts, 2013 (cat. no. 4655.0.55.002)
Australian Government Department of the Environment, 2013, 'Climate change impacts in Australia', web page accessed 8 October, 2013
(The then) Australian Government Department of Industry, Innovation, Climate Change, Science, Research and Tertiary Education, 2013, National Inventory Report 2011, Volume 2
Climate Commission, 'Effects', website archived by the National Library of Australia, website accessed 8 October 2013 <http://pandora.nla.gov.au/>
Hyder Consulating, 2012, Waste and Recycling in Australia 2011, DSEWPaC <http://www.environment.gov.au>
State of the Environment 2011 Committee, 2011, 'Australia: State of the environment, 2011', Independent report to the Australian Government Minister for Sustainability, Environment, Water, Population and Communities, Canberra, DSEWPaC <http://www.environment.gov.au/>
|
Click on the links below to be taken to a summary of the graphs from the corresponding tab within the sustaining the environment theme:
Overall progress?
Natural resources
Waste management
Climate change
|
| OVERALL PROGRESS? |
 |
Australia's net greenhouse gas emissions(a), excluding wildfires |
 |  |  |
 |  |  |
Headline progress indicator |  | ...over the longer term |
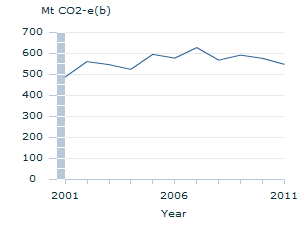
Footnote:
(a) Based on UNFCCC Inventory.
(b) Million tonne of Carbon Dioxide equivalent.
Source:
Unpublished data provided by the then Department of Industry, Innovation, Climate Change, Science, Research and Tertiary Education, September 2013 |  | 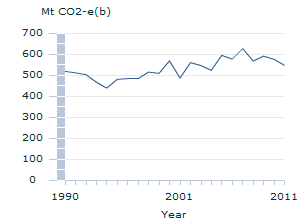
Footnote:
(a) Based on UNFCCC Inventory.
(b) Million tonne of Carbon Dioxide equivalent.
Source:
Unpublished data provided by the then Department of Industry, Innovation, Climate Change, Science, Research and Tertiary Education, September 2013 |
 |  |  |
 |  |  |
 |  |  |
...by sector |  |  |
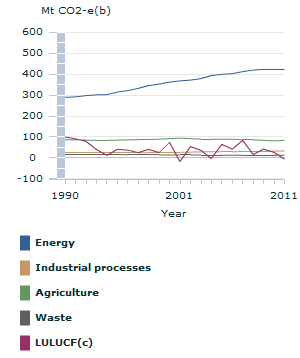
Footnote:
(a) Based on UNFCCC Inventory.
(b) Million tonne of Carbon Dioxide Eqivalent.
(c) Land Use, Land Use Change and Forestry.
Source:
Unpublished data provided by the then Department of Industry, Innovation, Climate Change, Science, Research and Tertiary Education, September 2013 |  |  |
 |  | |
 |  |  |
 |  |  |
|
| NATURAL RESOURCES |
 |
Natural capital(a) per capita, chain volume measures(b)(c) |
 |  |  |
 |  |  |
Progress indicator |  |  |
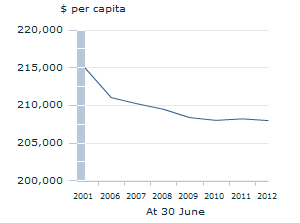
Footnote:
(a) Subsoil assets, land and timber are being used as an estimate of natural capital. Water, habitat and ecosystems and soil resources are not explicitly included.
(b) Reference year for chain volume measure is 2010-11.
(c) Note that there is a five year gap between the first two years in the graph, followed by consecutive years of data.
Source:
ABS Information Paper: Towards the Australian Environmental-Economic Accounts, 2013 (cat. no. 4655.0.55.002) |  |  |
 |  | |
 |  |  |
 |  |  |
|
| WASTE MANAGEMENT |
 |
Waste disposed per capita(a) |
 |  |  |
 |  |  |
Progress indicator |  | ...by state and territory |
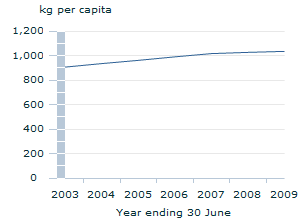
Footnote:
(a) For a fairer comparison over time, Fly ash is excluded in 2008-09 (Fly ash being the largest contributor of the additional waste categories reported that year due to a change in methodology). Data for years in between Waste and Recycling in Australia reports are estimates using linear interpolation (2003-04 to 2005-06 and 2007-08).
Source:
Hyder Consulting, Waste and Recycling in Australia 2011 |  | 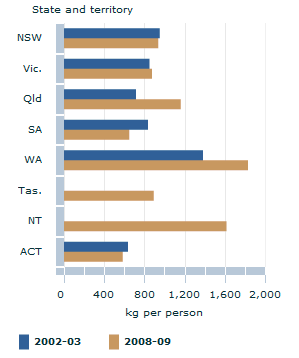
Footnote:
(a) For a fairer comparison over time, Fly ash is excluded in 2008-09 (Fly ash being the largest contributor of the additional waste categories reported that year due to a change in methodology).
(b) 2002-03 data not available for Tasmania and Northern Territory.
Source:
Hyder Consulting, Waste and Recycling in Australia 2011 |
 |  | |
 |  |  |
 |  |  |
|
| CLIMATE CHANGE |
 |  |  |
Australia's net greenhouse gas emissions(a), excluding wildfires |
 |  |  |
 |  |  |
Progress indicator |  | ...over the longer term |
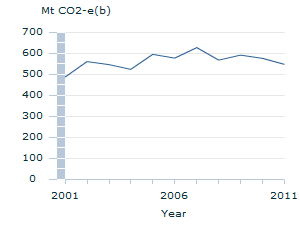
Footnote:
(a) Based on UNFCCC Inventory.
(b) Million tonne of Carbon Dioxide equivalent.
Source:
Unpublished data provided by the then Department of Industry, Innovation, Climate Change, Science, Research and Tertiary Education, September 2013 |  | 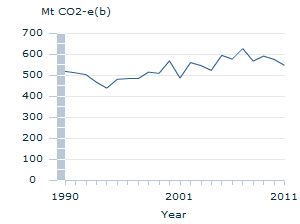
Footnote:
(a) Based on UNFCCC Inventory.
(b) Million tonne of Carbon Dioxide equivalent.
Source:
Unpublished data provided by the then Department of Industry, Innovation, Climate Change, Science, Research and Tertiary Education, September 2013 |
 |  |  |
 |  |  |
 |  |  |
...by sector |  |  |
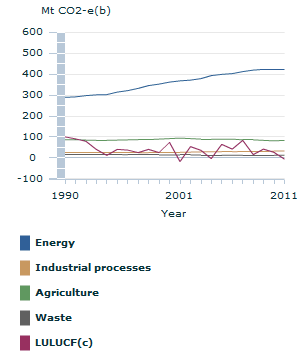
Footnote:
(a) Based on UNFCCC Inventory.
(b) Million tonne of Carbon Dioxide Eqivalent.
(c) Land Use, Land Use Change and Forestry.
Source:
Unpublished data provided by the then Department of Industry, Innovation, Climate Change, Science, Research and Tertiary Education, September 2013
|  |  |
 |  | |
|
|
|